What Is A Biodiversity Distribution Map And What Is It For?
Biodiversity distribution maps are tools used by biologists to describe the patterns of living beings on the planet. Knowing the habitats of the species is key to their conservation. For its elaboration, a huge number of factors are taken into account.
How are distribution maps prepared and according to what criteria? What factors make species live where they do? We will answer all these questions in the following lines.
The distribution of biodiversity: factors that affect it
The various species of animals and plants that inhabit our planet have different vital requirements. Some species like cold places in the polar zones. Other animals, on the other hand, prefer the conditions of extreme humidity and high temperature of the equatorial forests, as in the case of orangutans .
We call the set of biotic and abiotic requirements that a species has for its survival ecological niche. The ecological niche is the set of factors in which a species feels comfortable, that is, its optimal conditions for living.
This ecological niche is mainly shaped by conditions of temperature, humidity, soil type and other environmental parameters, which are abiotic factors. In terms of biotic factors, animals need to live wherever their food is found and there is little competition for the same types of resources.
General patterns of biodiversity distribution
Once explained on the basis of what the species are distributed, we can emphasize a series of generalities about the distribution of biodiversity at the terrestrial level.
A very important phenomenon regarding this issue is known as the latitudinal biodiversity gradient. Broadly speaking, this postulation indicates that biodiversity is greater around the Equator and decreases little by little as we approach the poles, with the exception of the deserts.
This is so because the most suitable conditions for a huge number of species are found at the equator : high temperatures, solar radiation and high relative humidity. All this promotes the appearance of more vegetation, which usually translates into more animals.
In general, warmer and more humid places tend to support greater biodiversity than cold and dry ones. This is because plants, which are the base of the trophic pyramid, tend to grow better under these conditions.
How the maps are made
Originally, mapping the distribution of animal species involved making arduous censuses where species were known to exist. In these cases, individuals were counted and their distribution estimated. This began to be done in the 17th century, when the first naturalists began to describe and count the species they found.
Nowadays, the techniques have improved a lot and are carried out on the basis of mathematical models. Certain statistical programs spatially model the ideal conditions for a specific species of each factor. By putting all these maps together where the factors are ideal, you get a map where the species are most likely to be found.
Biodiversity maps: counting the number of species
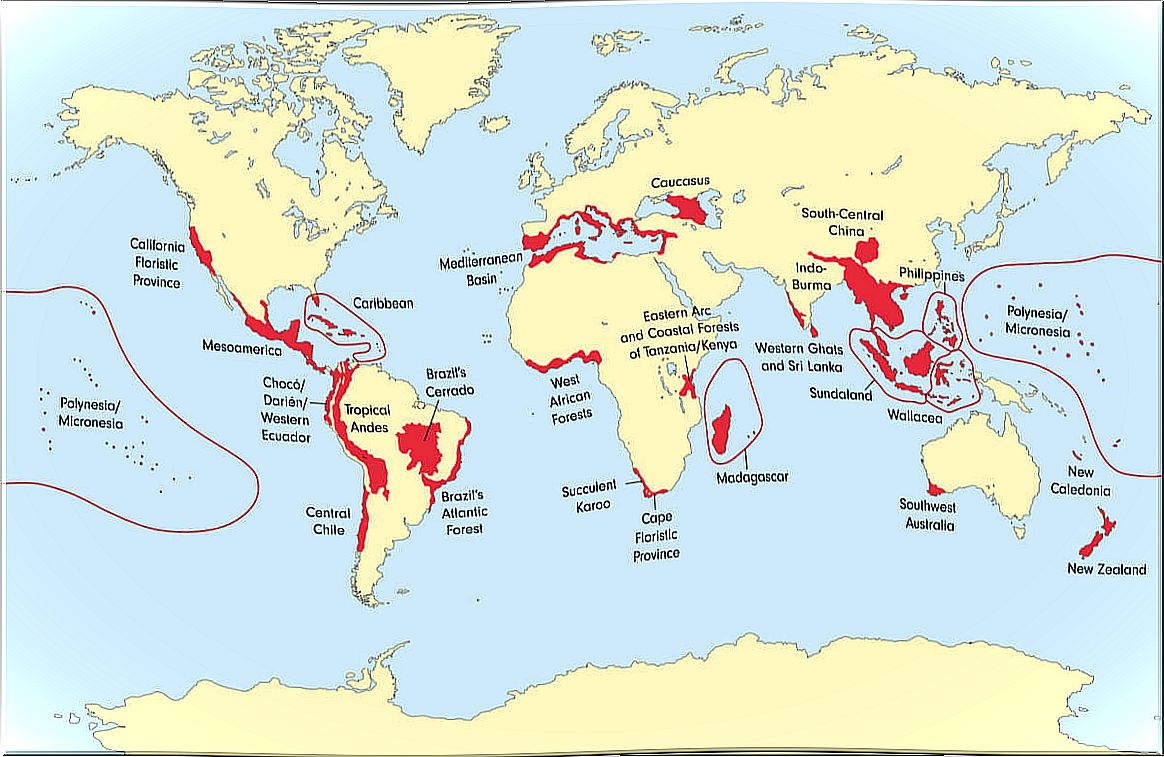
We have talked about species distribution maps, but now we will delve into another type of map: those that measure the number of species per area, that is, biodiversity. These maps are used to know where there are more number of species.
These maps are divided into regular units (tiles), where the number of species present is counted. This map is used to determine which areas are richer in biodiversity, where protected areas can be established.
If, for example, in a mountainous area we have 4 tesserae with 25 species of amphibians, the relevant Administration will consider protecting this area from others for the conservation of this taxonomic group. Unfortunately, money is not unlimited and sometimes you have to choose.

Uses of distribution maps
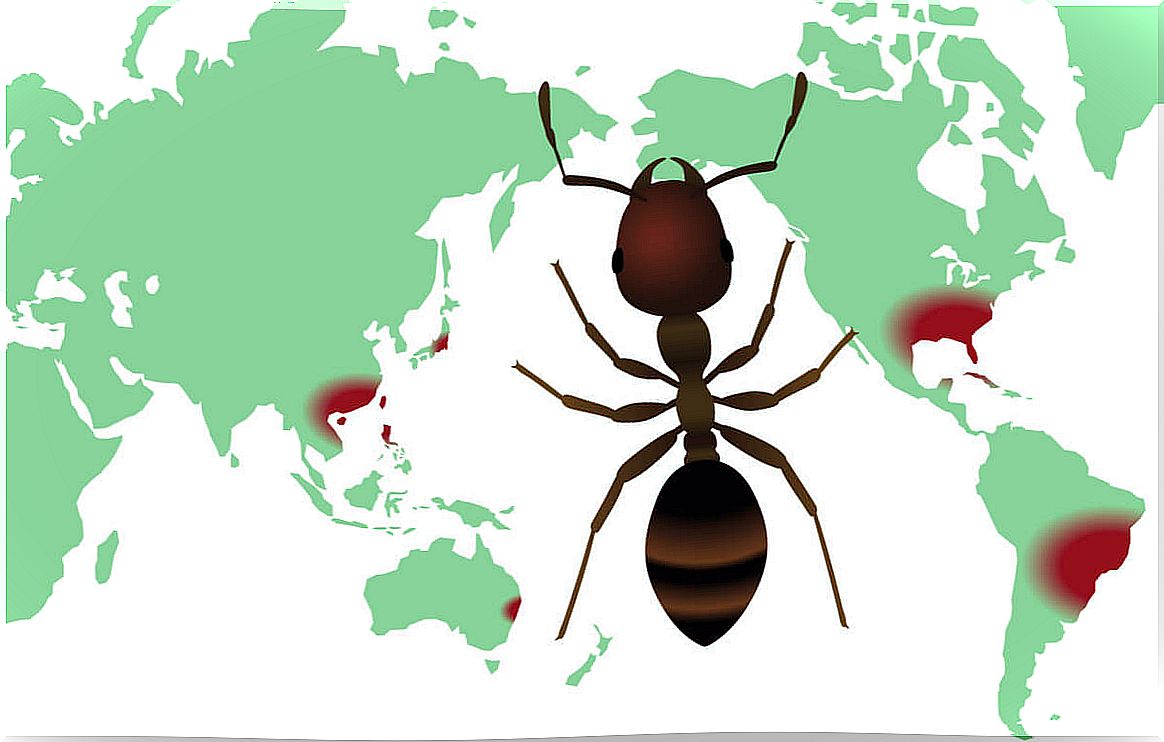
Biodiversity distribution maps are an excellent tool used to find out where species are and what ecological niche they occupy. They can be very important in conservation tasks to know which spaces it would be necessary to protect from degradation.
Biodiversity maps in the strict sense — of number of species — are extremely useful for cataloging those areas where there is a lot of biodiversity and need protection. Otherwise, thanks to these documents, concrete action plans can be established for areas with little biological diversity.